


HYPE was changing hands around $89.13 at the time of writing, registering a 4.5% decline over the trailing 24 hours and a 5.4% drop across seven days.
Earlier in the session, the token traded near $93 before breaching $92 and $90 to the downside, further extending its pullback from the all-time high achieved the previous week.
Activity among large token holders has emerged as a primary catalyst for the downward pressure on HYPE.
According to Lookonchain, one wallet deposited 177,518 HYPE—valued at $16.08 million—into OKX and Bybit on Sept. 28. Concurrently, another wallet associated with Hypersphere Ventures offloaded 62,869 HYPE for $5.78 million.
While exchange deposits do not guarantee that the entirety of funds will be liquidated, these actions followed a series of substantial HYPE transfers throughout the week.
Crypto.news reported that Multicoin Capital transferred an additional $12.15 million in HYPE to Coinbase Prime last week.
That transaction contributed to a cumulative total of 4.23 million HYPE deposited by the entity since July 28, representing $285 million at the respective transfer times.
Furthermore, five separate whale addresses initiated the unstaking of HYPE valued at roughly $90.4 million.
Once the unstaking phase concludes, these tokens become eligible for transfers or open-market sales.
This wave of distribution has unfolded alongside liquidations within the HYPE perpetual derivatives market.
Data from Coinglass shows open interest on Hyperliquid hovered near $1.86 billion early on Sept. 28, while the hourly funding rate held positive at 0.0013%, indicating that long traders were compensating short positions.
The recent descent follows HYPE’s peak of $97.98 reached on Sept. 23. Historical Coingecko pricing records document subsequent daily closes near $94.05, $92.10, $92.30, $92.61, and $91.68 leading up to Sept. 27 as market participants secured profits following the record-setting rally.
Meanwhile, Binance’s fresh spot listing has streamlined the process for HYPE holders to divest holdings via one of the industry’s premier liquidity pools, introducing an extra vector for potential selling momentum as large accounts capitalize on gains.
How low can HYPE price go?
HYPE is currently examining its initial critical support level following the retreat from its $97.98 record high, with the daily 20-day EMA positioned at $88.42—just underneath the current $89.17 price point. See below.
HYPE/USDT 1-day price chart. Source: TradingView.
A confirmed daily close under $88.42 would undermine that support tier, exposing the 50-day EMA at $80.96 and establishing a prospective downside target near $81.
Should selling pressure breach the $81 threshold, the 100-day EMA at $72.77 would serve as the subsequent major floor, though current valuations remain comfortably above that marker.
The daily RSI has slid to 54.71 from reading above 70 during the September advance, slipping underneath its moving average line of 61.25.
While this confirms a significant cooling of momentum, the RSI remains above the 50 centerline and has avoided oversold territory, allowing room for bears to drive prices down further prior to reaching historically heavy selling thresholds.
Perspectives from the 4-hour chart reinforce the vulnerability of a breach beneath the $88 threshold. HYPE has drifted past core Fibonacci retracement milestones mapped from the $89.91-to-$97.99 swing, while the MACD indicator maintains a bearish posture. See below.
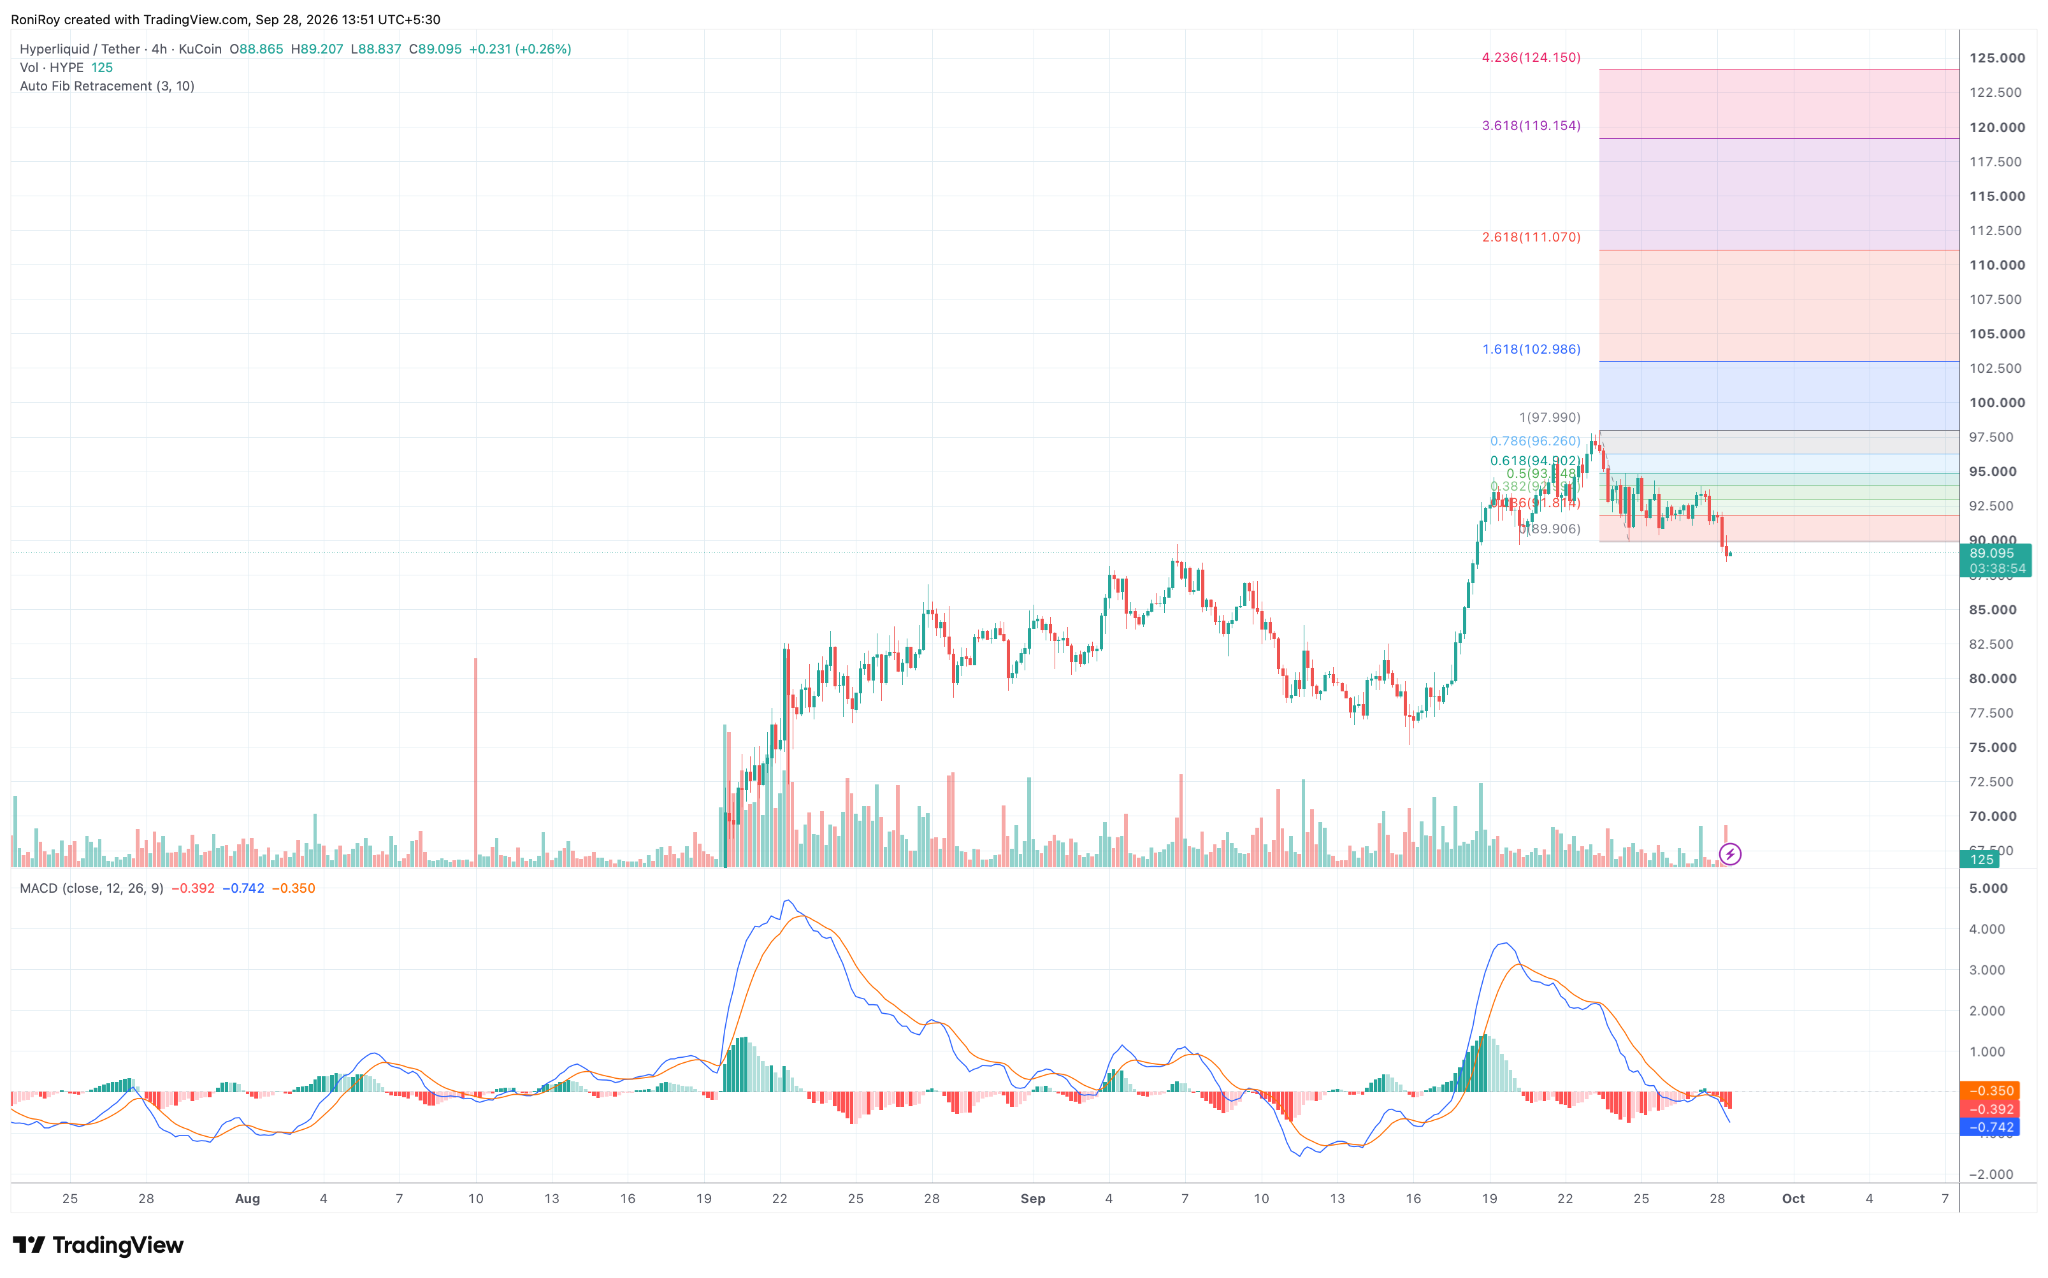
HYPE/USDT 4-hour price chart. Source: TradingView.
Specifically, the MACD line printed at minus 0.742, trailing beneath the signal line at minus 0.350, accompanied by a negative histogram value of minus 0.392.
Consequently, a breakdown under the $88–$89 zone would shift immediate focus to $80.96 as the primary downside objective.
If the $81 floor collapses, the daily 100-day EMA close to $72.77 provides the subsequent technical support line.
To alleviate near-term downward pressure, HYPE must first recapture $89.91.
Subsequent Fibonacci resistance barriers line up near $91.81 and $93, followed by obstacles at $94.92 and $96.26 ahead of the $97.99 zenith.
Frequently Asked Questions
What caused HYPE to fall below $90?
HYPE’s decline was driven by heavy selling from large holders, major exchange deposits, unstaking activity, and perpetual market liquidations following its recent record high.
What are the key support levels to watch?
Immediate support sits near the 20-day EMA at $88.42, followed by the 50-day EMA at $80.96 and the 100-day EMA at $72.77.
Where is HYPE facing resistance on the upside?
If HYPE attempts a recovery, it needs to reclaim $89.91, with further resistance levels stacked near $91.81, $93, $94.92, and $96.26.
What is the current status of HYPE’s market momentum?
The daily RSI has cooled to 54.71 and the 4-hour MACD remains bearish, indicating that momentum has slowed considerably but has not yet reached oversold conditions.

